5. Group-level Analysis Workflows
The BrainSuite BIDS App’s group-level stage offers hypothesis testing for outputs generated from the participant-level processing stage of the BrainSuite BIDS App. Two main workflows are used for performing statistical tests: bstr for structural MRI outputs and BrainSync/python tools for functional MRI outputs.
A summary of available analyses and statistical tests are shown in the table below:

5.1. Group-level Analyis of Anatomical and Diffusion Data
In the BrainSuite BIDS App, statistical tests on anatomical and diffusion outputs are done using the BrainSuite Statistics Toolbox in R bstr, which is an open-source R toolbox for analyzing population-level neuroimaging data processed using BrainSuite. Bstr can be used outside of the BrainSuite BIDS App as a stand-alone R toolbox in R. In the BrainSuite BIDS App, we have configured the R environment and installed any necessary dependencies to be able to run bstr.
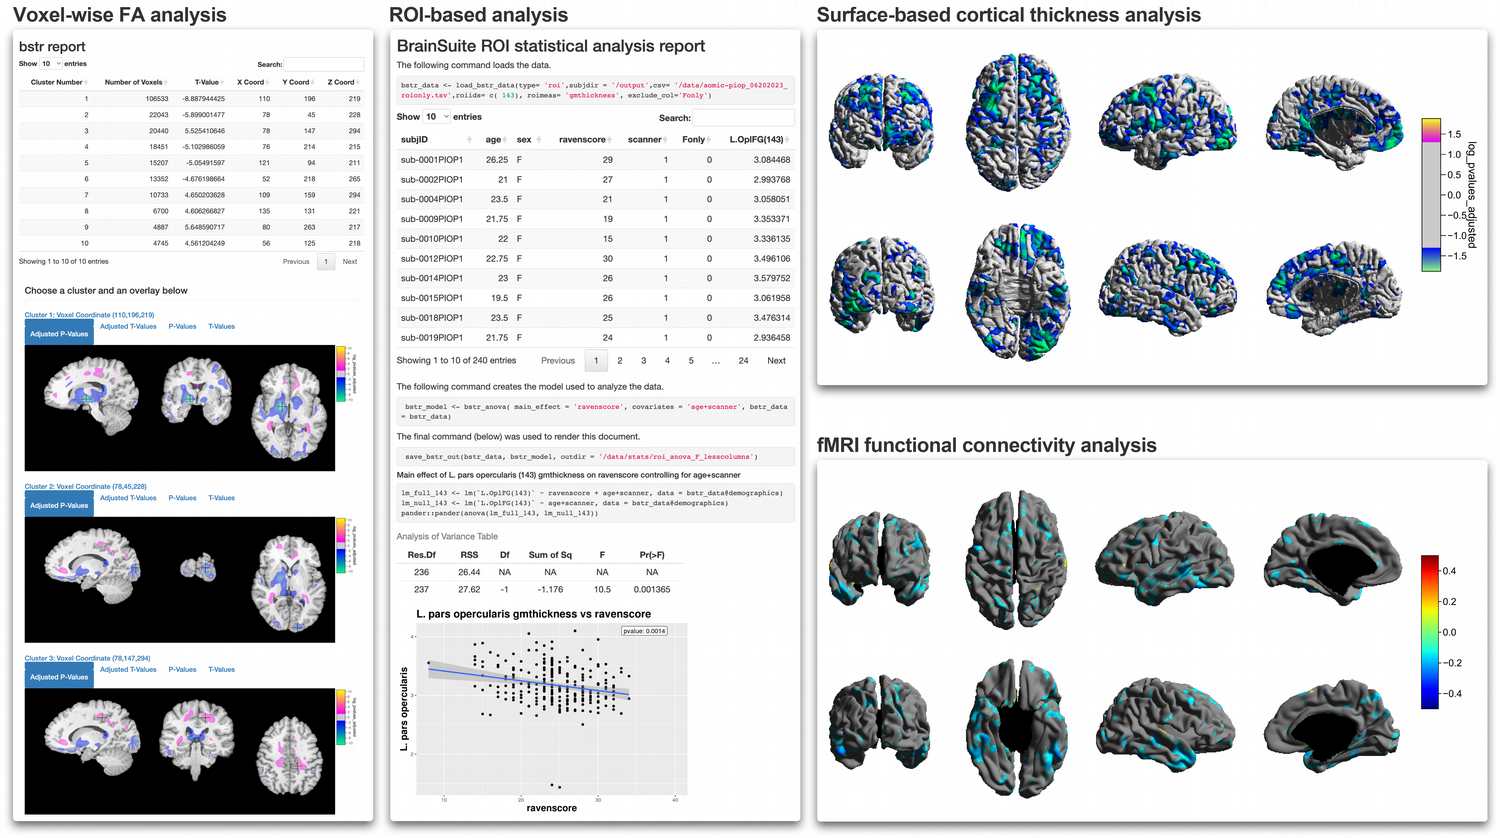
Bstr offers the following features and methods:
Volumetric tensor based morphometry: voxel-wise analysis of the magnitude of the 3D deformation fields representing volumetric shrinking and expansions.
Surface based analysis: vertex-wise analysis of cortical thickness measures on brain surfaces in the atlas space.
Diffusion parameter maps analysis: voxel-wise analysis of DTI parameter maps (e.g., fractional anisotropy, mean diffusivity, radial diffusivity) resampled from subject coordinates to a common atlas space.
ROI-based analysis: analysis of average gray matter thickness, surface area, and gray matter volume over a cortical ROI.
Functionality for linear regression, ANOVA, interaction effects, and t-tests for hypotheses for cortical surface and volumetric imaging data.
Testing for multiple comparisons includes the False Discovery Rate correction and nonparametric permutation tests.
For surface-based analyses, the outputs generated by bstr include separate right and left mid-cortical surface maps in the atlas space that store unadjusted and adjusted t-values and log p-values thresholded by level of significance (p < 0.05) at each vertex. For volumetric-based analyses, adjusted and unadjusted t-value and log p-value volumetric overlays and the corresponding lookup table (LUT) files are produced. The LUT files follow the same color scheme as the surface files.
5.1.1. Automated report generation of statistical results
Bstr supports functionality for automated report generation to visualize statistical results using R-shiny and R markdown. The volumetric analysis report contains the cluster table, visualizations of clusters on image slices, and shows both the unadjusted and the adjusted versions of p-values and t statistics, respectively. The ROI analysis report shows the demographic spreadsheet, automatic bar plots for ANOVA and regressions, and scatter plot for correlation analyses. Moreover, for the ROI analysis report, bstr exports an R markdown report that contains reproducible R commands in both the Rmd file and in the html document. This enables complete reproducibility of statistical results and only requires packaging the R markdown file along with the data.
5.2. Group-level Analysis of Functional Data
In the BrainSuite BIDS App, statistical tests on functional MRI outputs are performed using BrainSync and Python tools and scripts. BrainSync is an orthogonal transform that performs temporal alignment of time-series at homologous locations across subjects allowing direct comparison of scans. Custom fMRI atlases are created within the group-analysis workflow using BrainSync Alignment (BSA), a method that jointly synchronizes fMRI data across the time-series data of multiple subjects [Akrami2019].
Functional data group-level analysis is called from a Python script and reads grayordinate BFP outputs. Results are generated in grayordinate space, as well as labeled cortical representations generated on BrainSuite surface files and noncortical results written out as 3D NIfTI files.
We offer two types of analyses:
Atlas-based analysis: creates a custom reference atlas using BSA based on the subject data specified by the user, synchronizes the fMRI data of the atlas and each subject, then computes measures of similarity between the atlas and the subject’s time-series data.
Atlas-free analysis: performs statistical tests for associations and group differences using pair-wise distances between random pairs of subjects’ fMRI data as well as the pairwise differences between the corresponding test variable or group indicators.
For the atlas-based analysis, the statistical tests perform:
Pearson correlations and controls for covariates using linear regression. The correlation coefficient and unadjusted and adjusted p-values (FDR) are reported.
For the atlas-free analysis, the statistical tests perform:
Pearson correlation to test for associations, and t-tests to test for group differences. The correlation coefficient and unadjusted and adjusted p-values (FDR) are reported.
The outputs generated by these analyses include surface and volumetric files in the grayordinate space containing R-values and unadjusted and adjusted p-values.