Surface/Volume Registration Exercises
Comparisons between subjects/scans (especially using automated tools) often require aligning the images to the same space and orientation, a process called registration. While two images can be registered to each other for comparison, registering both images to an atlas enables automatic labeling of cortical and subcortical regions on the scans. This in turn makes it easier and faster to analyze regions of interest across subjects, particularly for large numbers of scans. BrainSuite is able to register and label a brain to an atlas manually labelled by an expert neuroanatomist, either via the graphical user interface (GUI) or a command-line process for batch jobs. This tutorial takes you through the GUI, which is useful for checking the process on a few scans before setting up for a batch job on several scans.
SVReg requires many of the files generated by the Cortical Surface Extraction sequence. If you ran through the CSE guided exercises then you already have the files you need; if not, you can download them here. Unzip them to an easy-to-access location (such as your desktop), and then open 2523412.nii.gz in BrainSuite before continuing.The file 2523412.nii.gz is part of the Beijing Enhanced dataset, released by Beijing Normal University as part of the International Neuroimaging Datasharing Initiative (INDI) under a Creative Commons Attribution-NonCommerical 3.0 Unported License (CC-BY-NC). More information on the complete dataset is available online here, and it can be downloaded from NITRC.
Surface/Volume Registration
- After running the Cortical Surface Extraction Sequence, check that the skull-stripped scan and generated pial surfaces look correct (e.g. pial surface lines up with the surface in the image).
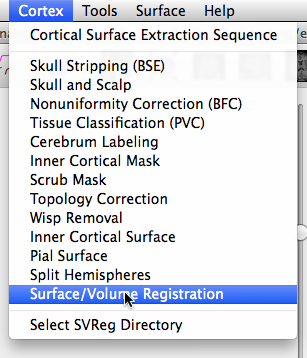
- Open the Surface/Volume Registration dialog by clicking on Cortex > Surface/Volume Registration

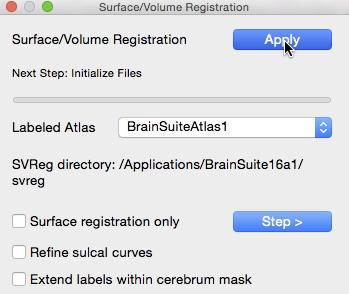
- From this dialog, you can toggle SVReg-specific options such as:
- choosing different reference atlases
- running sulcal refinement for improved results at the expense of longer computation time
- performing only surface registration or both surface and volume registration
- allowing extension of the ROI labels within the cerebrum mask generated by CSE
Default settings will use the pial surface mask and run both surface and volume registration without refinement, as demonstrated in this tutorial. Click “Apply” to start the registration process. Registration is computationally intensive so you may notice some slowing in other programs while it is underway. The process should take around 1 hour and will open different dialogs to keep you apprised of the current progress. The surface and volume views will also update.

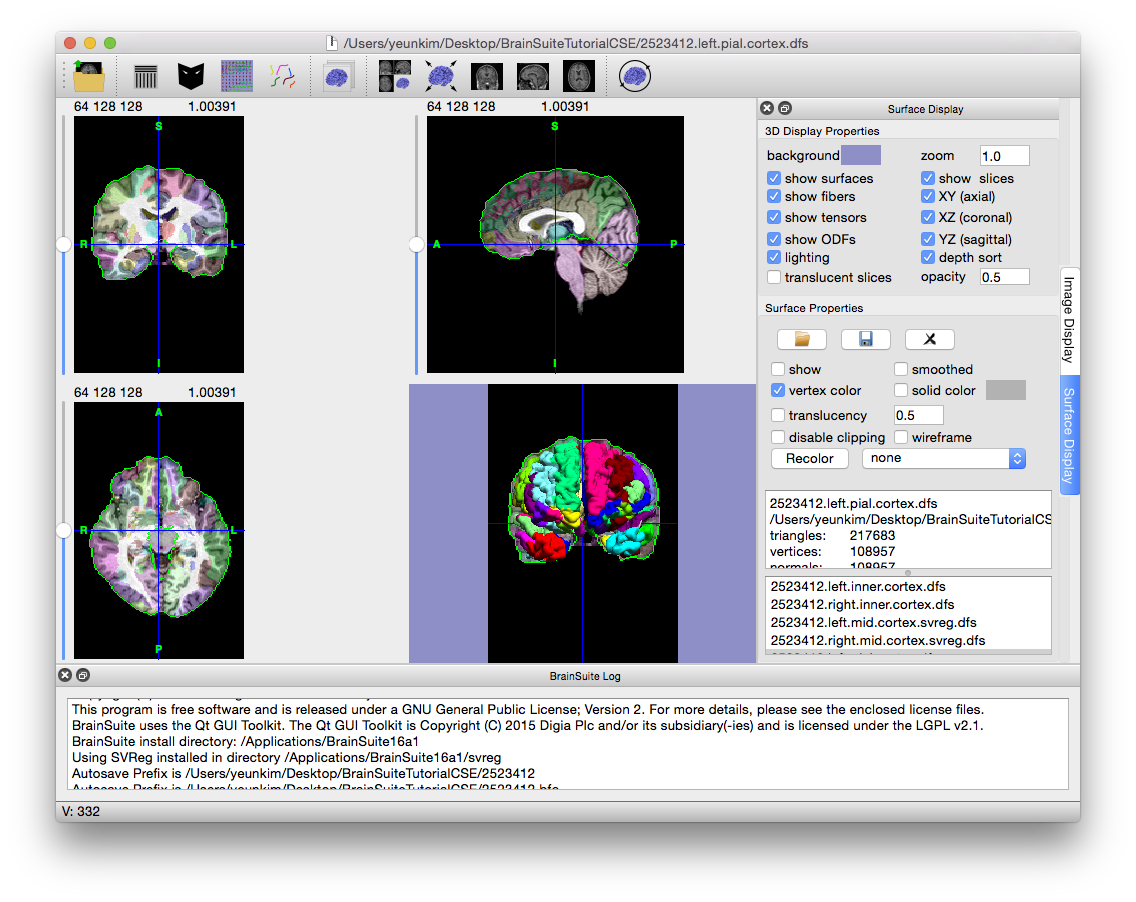
- When the registration and labeling process is complete, the surface viewer shows the labeled mid cortical surface generated by the registration process.
- Using both the orthogonal and surface views, familiarize yourself with the processed image. You can press Ctrl+V (Cmd+V on Mac) to hide the volume slices in the surface view, making it a bit easier to explore the surface. The orthogonal slice views show the volumetric labels applied by
SVReg. Clicking on a labeled structure in the slice view or double clicking a structure in the surface view will show the structure name on the bottom frame of the main BrainSuite window. Also note thatSVRegregisters and labels the cerebrum only. The CSF in the ventricles is labeled as part of the left or right ventricular system, depending on which hemisphere it is in. - The labels are actually 16-bit volumes, meaning that each structure label is a number between 0 and 65536. To analyze the scans automatically, it’s necessary to know which number corresponds to the region you’re interested in. When the structure name is listed at the bottom of the application window, the number assigned to it will also be displayed, as L: ####. Open the folder where the scan (and all of the files generated by the CSE sequence and
SVReg) are located and open brainsuite_labeldescription.xml - This XML file describes all the labels used in the structural atlas delineation. The
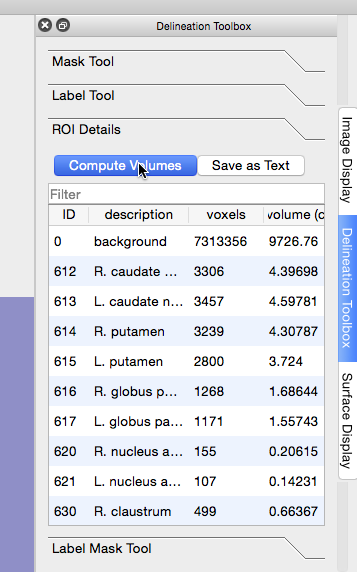
idattribute is the number of the label (the value of the voxel with that label),fullnameis the name of the structure, andcoloris its display color in BrainSuite. Again, take some time to look through the list and see which structures are labeled, especially those that you’re interested in. This list of structures is also available by accessing the “ROI Details” tab of the “Mask Tool” dialog box and clicking “Compute Volumes”.
If you have diffusion data from the same subject, BrainSuite can combine the results of SVReg with tractography to allow analysis and visualization of the connectivity between labeled regions. Processing the diffusion data is handled by the BrainSuite Diffusion Pipeline, a command-line program, while the visualization and connectivity analysis is handled by the BrainSuite GUI.

