Cortical-based morphometry (CBM) is a neuroimaging method to assess cortical thickness differences in brains.
For this tutorial, we will be looking at the effect of age (via ANOVA) on cortical thickness within the left hemisphere, when controlled for sex, in 25 subjects.
Pre-Requisites
USC2015_BrainSuiteWorkshop, in which you will find the ICBM25 folder containing the necessary files to run this tutorial.- Prior to running CBM in BrainSuite Statistics toolbox (BSS), Cortical Surface Extraction and Surface/Volume Registration need to be run on your subject data.
- Next,
thicknessPVChas to be run to obtain cortical thickness data*. This script computes the cortical thickness using partial fraction volume. Moreover, it stores these thickness measures into separate hemisphere files and maps the subject thickness surfaces to the atlas hemisphere surfaces. For this tutorial, the following command line was run:thicknessPVC.sh file_prefix - Lastly, smoothing has to be performed on the surface files. The script
svreg_smooth_surf_functionis used to smooth function defined on surface*. Surface based smoothing is typically required for compensating for the results of mis-registration. For this tutorial, the following command line was run:svreg_smooth_surf_function.sh atlas.pvc-thickness_0-6mm.left.mid.cortex.dfs atlas.pvc-thickness_0-6mm.smooth2.5mm.left.mid.cortex.dfs 2.5where the smoothing parameter is roughly, 2.5 (kernel FWHM in mm).
*For more information regarding thicknessPVC and svreg_smooth_surf_function, please go here and look under thicknessPVC under “Modules Usage and Descriptions”.
BSS: CBM Analysis Tutorial
BSS analyzes each hemisphere separately, so we will be performing the CBM analysis separately on each hemisphere.
<Left Hemisphere>
Data Preparation
This step modifies the demographics file, which contains data regarding subjects (i.e. gender, age, etc.), for analysis. It also writes out a modelspec.ini file, in which you can specify your model of interest.
- Open the terminal and navigate to your
ICBM25folder, located in theUSC2015_BrainSuiteWorkshopdirectory.
For example, in Mac:cd ~/Desktop/USC2015_BrainSuiteWorkshop/ICBM25 - On the command line, run (all in one line):
If Mac or Linux:/Application/BSS/bin/bss_prepare_data_for_cbm.py ~/Desktop/USC2015_BrainSuiteWorkshop/ICBM25 ICBM_demographics.csv modelspec_skeleton_cbm_left.ini left -sigma 2.5bss_prepare_data_for_cbm.pywill add the full paths of each*atlas.pvc-thickness_0-6mm.left.mid.cortex.dfsinto the demographics file, under the column header “File_cbm_left”. The usage for this script is the following (all in one line):<path to bss installation>/bin/bss_prepare_data_for_cbm.py master_subj_dir demographics_csv modelspec {left, right} [-sigma]smoothing_kernel_(mm)
Model Specification
- The
modelspec_skeleton_cbm_left.inidescribes subject and model information.
First, change theatlas=to reflect the locations of yourmri.left.mid.cortex.dfsatlas file.
Next, since we will be testing for the effect of age as main effect while controlling for sex, our full model will beAge+Sexand our null model will beSex. These variables need to be in the demographics file as column names (case-sensitive). Type in the full model next tofull model=and null model next tonull model=in the[model]section. Save this file.
Important!! The modelspec_skeleton_cbm_left.ini can only contain either the [model] or the [measure] section but not both. So delete the entire[measure]section.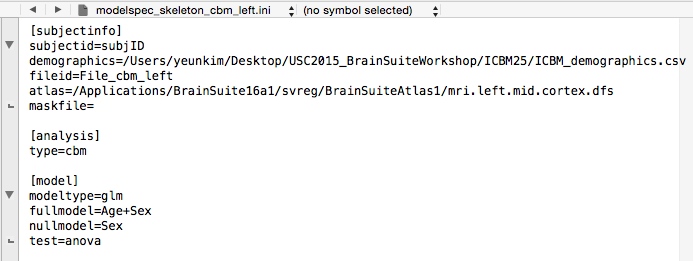
Run Group Analysis
- Finally, run
bss_run.pyin the terminal. If Mac or Linux:/Applications/BSS/bin/bss_run.py modelspec_skeleton_cbm_left.ini ~/Desktop/cbm_out
<Right Hemisphere>
Data Preparation
Again, this step modifies the demographics file, which contains data regarding subjects (i.e. gender, age, etc.), for analysis. It also writes out a modelspec.ini file, in which you can specify your model of interest.
- Open the terminal and navigate to your
ICBM25folder, located in theUSC2015_BrainSuiteWorkshopdirectory.
For example, in Mac:cd ~/Desktop/USC2015_BrainSuiteWorkshop/ICBM25 - On the command line, run (all in one line):
If Mac or Linux:/Application/BSS/bin/bss_prepare_data_for_cbm.py ~/Desktop/USC2015_BrainSuiteWorkshop/ICBM25 ICBM_demographics.csv modelspec_skeleton_cbm_right.ini right -sigma 2.5bss_prepare_data_for_cbm.pywill add the full paths of each*atlas.pvc-thickness_0-6mm.left.mid.cortex.dfsinto the demographics file, under the column header “File_cbm_right”.
Model Specification
- Same as
modelspec_skeleton_cbm_left.ini, themodelspec_skeleton_cbm_right.inidescribes subject and model information.
First, again, change theatlas=to reflect the locations of yourmri.right.mid.cortex.dfsatlas file.
Next, since we will be testing for the effect of age as main effect while controlling for sex, our full model will beAge+Sexand our null model will beSex. These variables need to be in the demographics file as column names (case-sensitive). Type in the full model next tofull model=and null model next tonull model=in the[model]section. Save this file.
Important!! The modelspec_skeleton_cbm_right.ini can only contain either the [model] or the [measure] section but not both. So delete the entire[measure]section.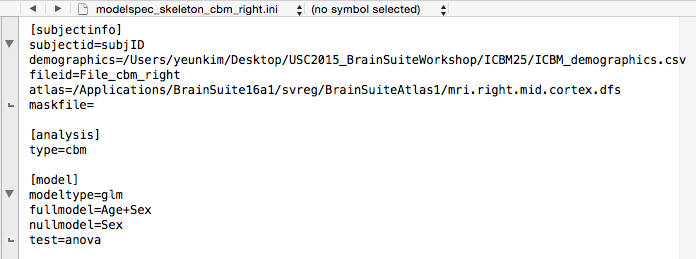
Run Group Analysis
- Finally, run
bss_run.pyin the terminal. If Mac or Linux:/Applications/BSS/bin/bss_run.py modelspec_skeleton_cbm_right.ini ~/Desktop/cbm_out
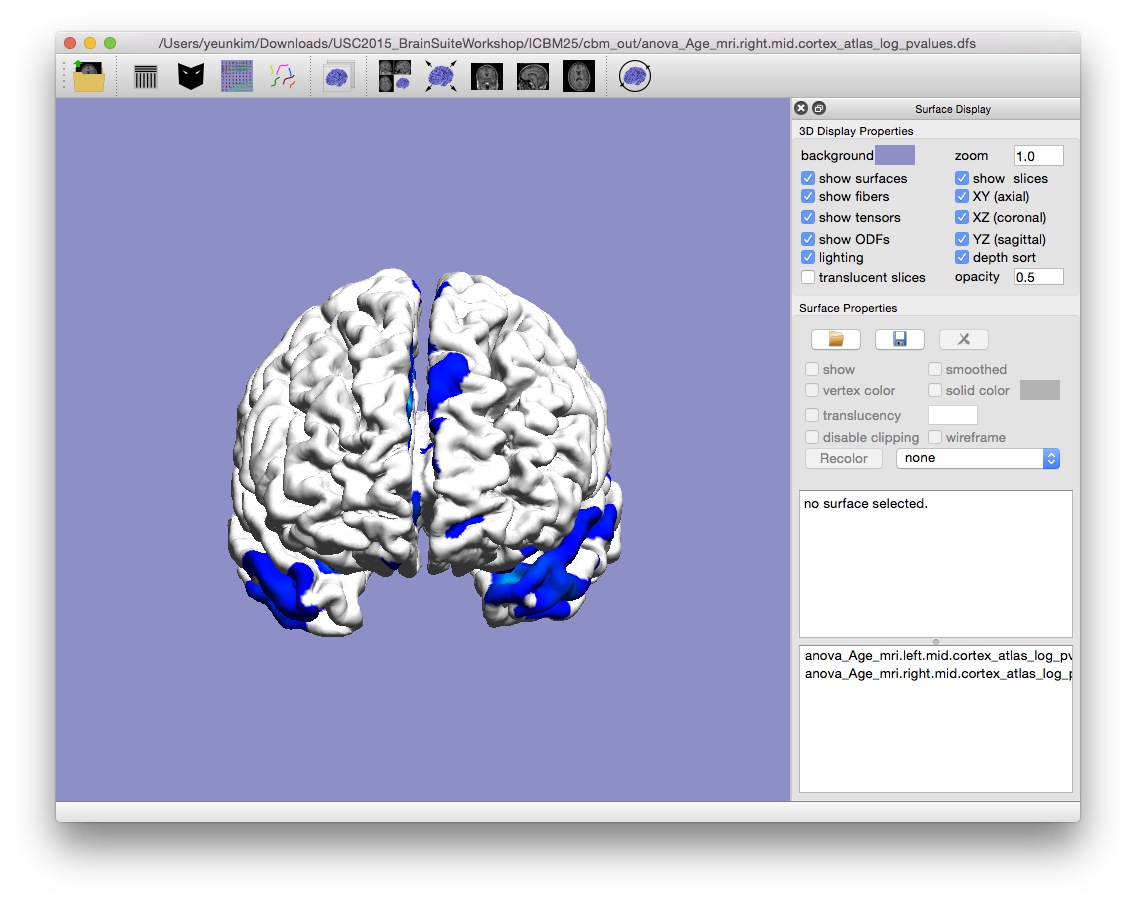
Visualization of results
- Drag and drop
anova_Age_mri.left.mid.cortex_atlas_log_pvalues.dfsandanova_Age_mri.right.mid.cortex_atlas_log_pvalues.dfsinto BrainSuite. These files contain logarithmic p-values denoting the significance of main effect Age. This file and the files mentioned below are located in thecbm_outfolder. - Open
anova_Age_mri.left.mid.cortex_unadjusted_pvalue_range.txtfor the range of logarithmic p-values. - To view the adjusted logarithmic p-values, load in
anova_Age_mri.*.mid.cortex_atlas_log_pvalues_adjusted.dfsas surface file on BrainSuite.anova_Age_mri.*.mid.cortex_adjusted_pvalue_range.txtfile will hold the adjusted logarithmic p-value range. There are also t-value outputs as well (i.e.anova_Age_mri.*.mid.cortex_atlas_tvalues_all.dfs(all t-values) andanova_Age_mri.*.mid.cortex_atlas_tvalues_adjusted.dfs(adjusted)).
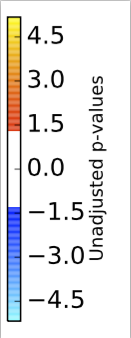
Open the
anova_Age_mri.left.mid.cortex_atlas_log_pvalues_cbar.pdf to see the color bar for the left hemisphere surface. For the right hemisphere, open the anova_Age_mri.right.mid.cortex_atlas_log_pvalues_cbar.pdf
Color bar for left hemisphere.
Color bar for right hemisphere.
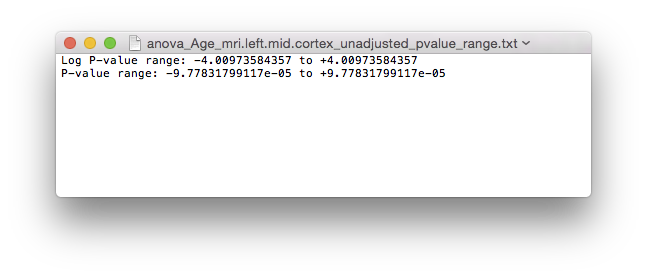
P-value range for left hemisphere.
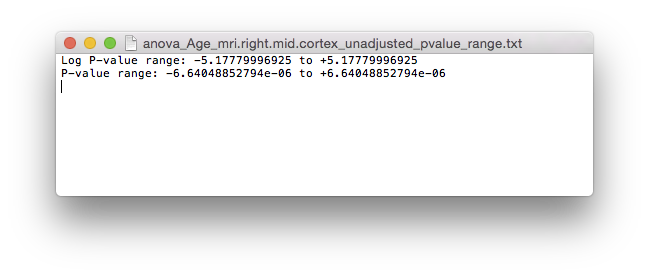
P-value range for right hemisphere