Tensor-based morphometry (TBM) is a neuroimaging method to assess regional differences in brain structure based on the Jacobian determinant of the deformation matrix.
Prior to running TBM in BrainSuite Statistics toolbox (BSS), Cortical Surface Extraction and Surface/Volume Registration need to be run on your subject data. All these processes have been run for this tutorial and are available here. Please download this file and unzip this file in a convenient location, such as your desktop. It contains the folder USC2015_BrainSuiteWorkshop, in which you will find ICBM25 folder containing the necessary files to run this tutorial.
For this tutorial, we will be looking at the correlation of age with change in brain volume (Jacobian determinants) in 25 subjects.
BSS: TBM Analysis Tutorial
Data Preparation
This step modifies the demographics file, which contains data regarding subjects (i.e. gender, age, etc.), for analysis. It also writes out a modelspec.ini file, in which you can specify your model of interest.
- Open the terminal and navigate to your
ICBM25folder, located in theUSC2015_BrainSuiteWorkshopdirectory.
For example, in Mac:cd ~/Desktop/USC2015_BrainSuiteWorkshop/ICBM25 - On the command line, run (all in one line):
If Mac or Linux:/Application/BSS/bin/bss_prepare_data_for_tbm.py ~/Desktop/USC2015_BrainSuiteWorkshop/ICBM25 ICBM_demographics.csv modelspec_skeleton_tbm.ini -sigma 2.5bss_prepare_data_for_tbm.pywill add the full paths of each*svreg.inv.map.jacdet.smooth*mm.nii.gzinto the demographics file. The usage for this script is the following (all in one line):<path to bss installation>/bin/bss_prepare_data_for_tbm.py master_subj_dir demographics_csvmodelspec [-sigma] smoothing_kernel_(mm)
Model Specification
- The
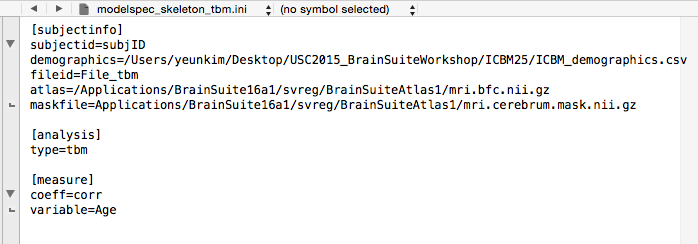
modelspec_skeleton_tbm.inidescribes subject and model information.
First, change theatlas=andmaskfile=to reflect the locations of yourmri.bfc.nii.gzandmri.cerebrum.mask.nii.gzatlas files, respectively.
Next, since we will be testing for the correlation of age with change in brain volume, our variable of interest will beAge. These variables need to be in the demographics file as column names (case-sensitive). Type in the variable next tovariablein the[measure]section. Save this file.
Important!! The modelspec_skeleton_tbm.ini can only contain either the [model] or the [measure] section but not both. So delete the entire[model]section.
Run Group Analysis
- Finally, run
bss_run.pyin the terminal. If Mac or Linux:/Applications/BSS/bin/bss_run.py modelspec_skeleton_tbm.ini ~/Desktop/tbm_out
Visualization of results
- In BrainSuite, load the atlas
mri.bfc.nii.gzlocated in theBrainSuite16a1/svreg/BrainSuiteAtlas1folder. - Load the overlay
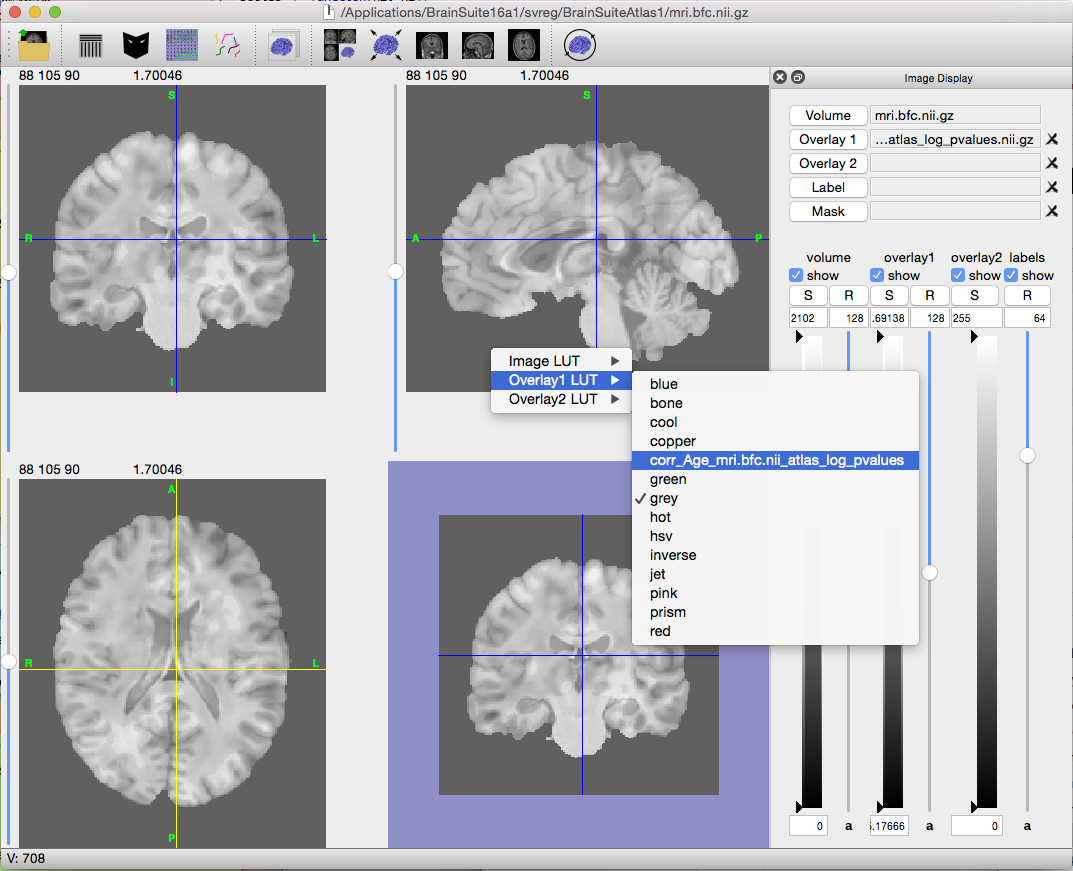
corr_Age_mri.bfc.nii_atlas_log_pvalues.nii.gz, which contains the unadjusted logarithmic p-values denoting the significance of correlation with Age. This file and the files mentioned below are found in thetbm_outfolder. - Drag and drop the LUT
corr_Age_mri.bfc.nii_atlas_log_pvalues.lut, which is the colormap for the logarithmic p-values. Right click on the overlay colormap and select the LUT.
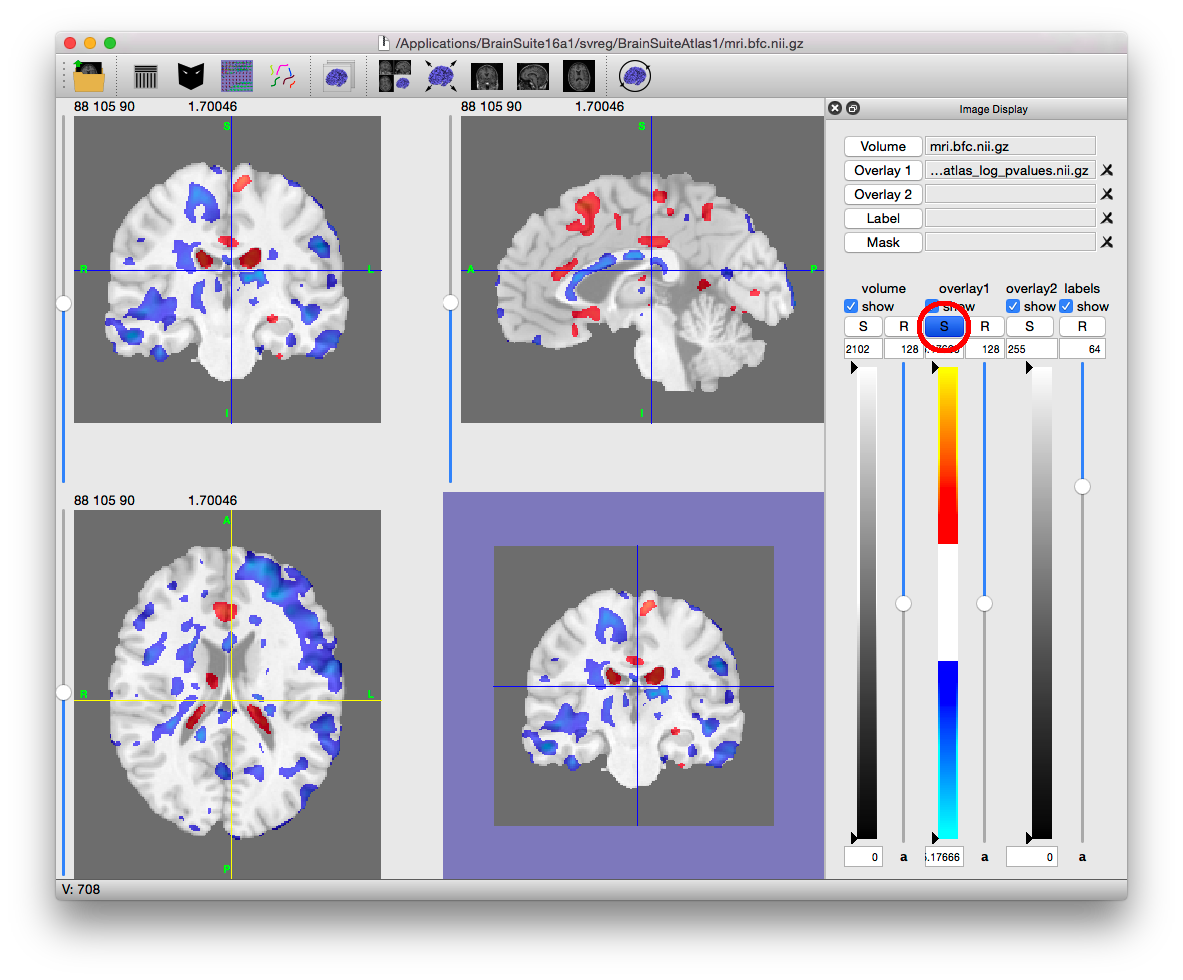
- Then click the “S” button on top of the color bar to make the colormap symmetric.
- To view the adjusted logarithmic p-values, load in
corr_Age_mri.bfc.nii_atlas_log_pvalues_adjusted.nii.gzas overlay andcorr_Age_mri.bfc.nii_atlas_log_pvalues_adjusted.lutas the LUT file.


